For me one of the most important factors for efficient local development is the ability to quickly toggle Xdebug on or off. In this guide I will show you how to configure Xdebug for Lando and PhpStorm.
The .lando.yml
Lando’s documentation instructs you to enable xdebug via the .lando.yml file. As of Lando RC2 you must set xdebug: true in order for the Xdebug extension to be loaded in your container. However, by default Xdebug will trigger on each request, which is not what we want because it makes local development painfully slow.
For more granular control it is better to configure Xdebug via php.ini, which should contain these lines:
xdebug.remote_enable = 1
xdebug.remote_autostart = 0
xdebug.remote_connect_back = 1
html_errors = 1
The first line tells Xdebug to try to connect to the IDE (i.e., PhpStorm), which will only happen if two conditions are met (see below). The second line tells Xdebug not to start debugging automatically; we want to control when Xdebug starts rather than have it run on every request. The third line tells Xdebug to try to connect to whichever client (i.e., your browser) that made the HTTP request. This setting is particularly important for reliable debugging with Nginx servers. The last line is not essential, but it’s nice to see error messages formatted in HTML instead of plain text.
Add this to .lando.yml in order to load the php.ini file:
config:
  config:
    php: php.ini
For anyone interested, here is my Lando WordPress configuration.
PhpStorm Debug Configuration
Configuring PhpStorm debug settings is actually fairly straightforward.
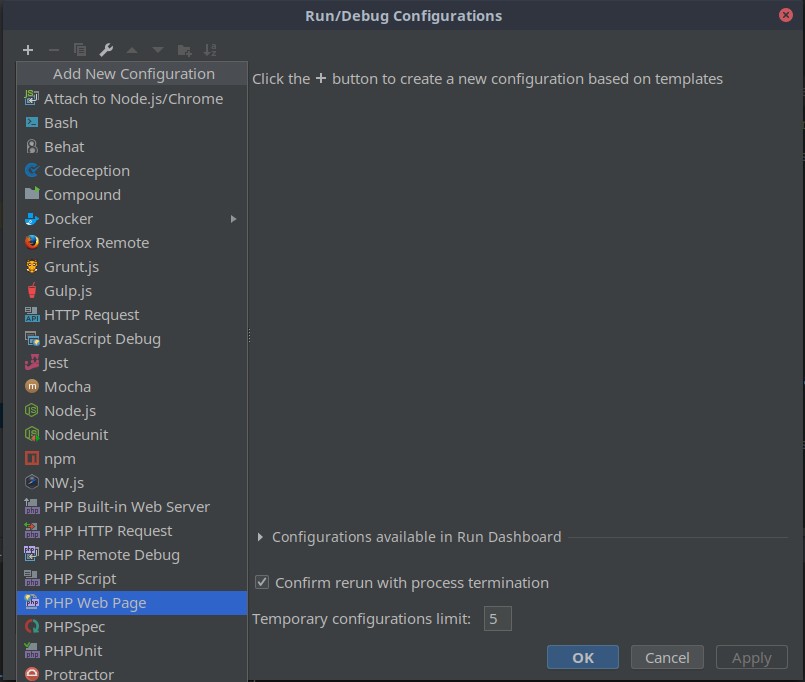
Click on Edit Configurations to open the Run/Debug Configurations dialog box. Choose the PHP Web Page option.
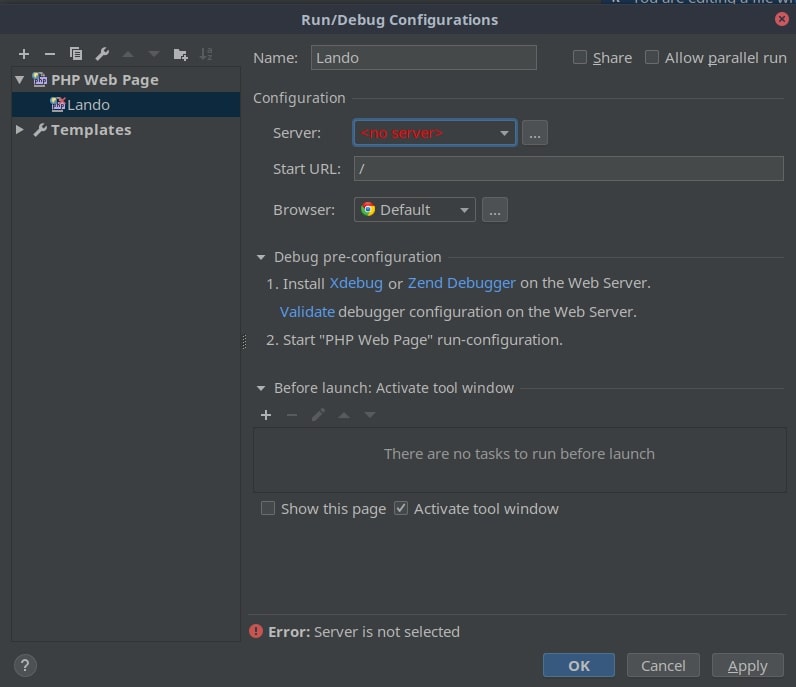
Give the configuration a name, such as Lando. Next click the … to add a server.
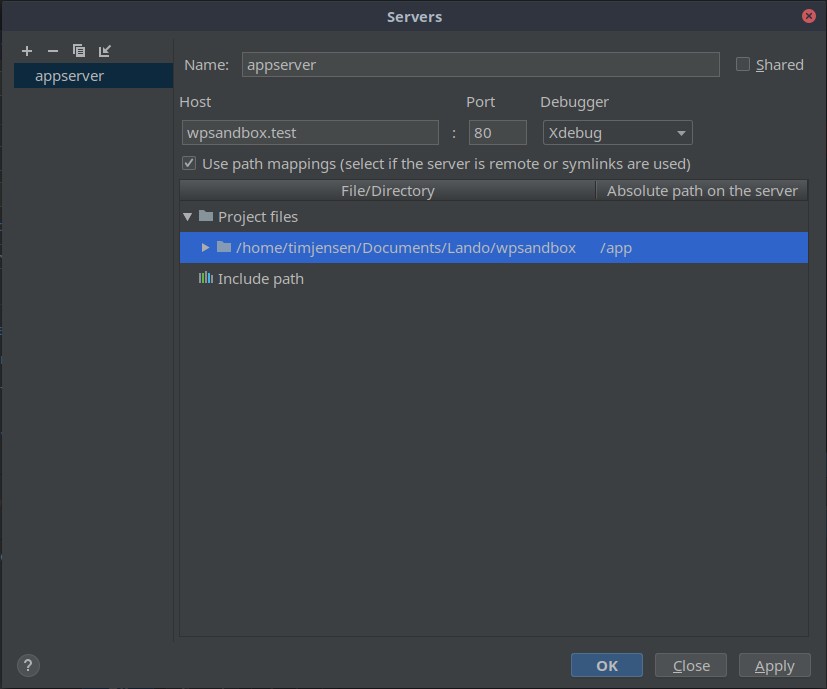
Configure a new server named appserver with a host of yourdevsite.tld.
Check the box for path mapping and map the project root to Lando’s app root, usually /app.
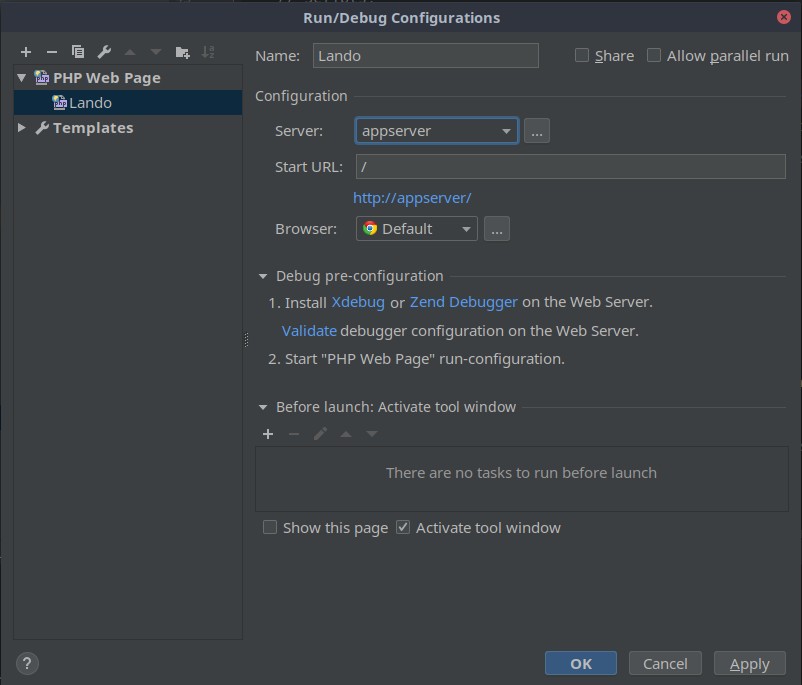
Click OK to save the settings.
Debugging Applications
If everything is configured correctly you are ready to debug. As I mentioned earlier there are two conditions that must be met in order to begin debugging.

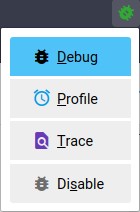
When you refresh your browser with these two settings enabled Xdebug will be activated. Make sure you have a breakpoint set in order to pause execution. The easiest way to toggle Xdebug is via the browser extension. Once you are finished, disable debugging from the browser extension and set PhpStorm to stop listening for Xdebug connections.
Debugging Scripts
You may also debug command line scripts such as phpunit. Triggering Xdebug for command line scripts is slightly different because we cannot use the browser extension. Instead we must set environmental variables.
- Set PhpStorm to start listening for Xdebug connections (same as above)
- SSH into the container:
lando ssh - Set the XDEBUG_CONFIG environmental variable:
export XDEBUG_CONFIG="remote_enable=1 remote_host=$LANDO_HOST_IP" - Set the PHP_IDE_CONFIG environmental variable:
export PHP_IDE_CONFIG="serverName=appserver". Note the name “appserver” must match the server name set under PhpStorm’s debug configuration. - Run the CLI script inside the container.
Troubleshooting
As always, logging is a big help when debugging any piece of software, and Xdebug is no exception. You can enable logging by adding xdebug.remote_log = "./xdebug.log" to the php.ini, which is particularly helpful when debugging fails for no apparent reason.
Mac users should find Selwyn Polit’s post helpful for fixing issues related to port availability.
Acknowledgements
The article Setting up Xdebug with Lando and PhpStorm as well as the comments were helpful in figuring out the settings that I’ve described here. Also, many thanks to the Lando developers for building what I consider to be the best local development environment and for providing excellent support for the software.
Hello Tim,
I’m sorry I can’t succeed to debug a WP-cli Command in a Lando/Phpstorm env.
I foollowed your settings and launch a lando wp my-cmd but still no debug.
Hi Sebastien, I admit I don’t have much experience debugging WP-CLI commands. Do you have your WP-CLI package installed as a plugin in your app directory? If so try this:
1. Add
xdebug.idekey = "PHPSTORM"to your php.ini.2. Once you restart your app, ssh into the appserver and run
export PHP_IDE_CONFIG="serverName=appserver".3. Set a breakpoint in your WP-CLI package and run the appropriate cli command.
Hi Sebastien, yesterday I ran into the same issue that you reported. After some investigation I got it working again and updated the “Debugging Scripts” section above. Hopefully that works for you!
Thank you so much for a succinct, easy to follow and clear instruction. Following these instruction I finally got it working on my projects. I am however getting an message below. Ignoring it by clinking ‘Don’t show again’ kinda solves this problem though. I guess you can safely ignore this message. It works besides the complaint.
Unfortunately I cannot stop debugging by” The easiest way to toggle Xdebug is via the browser extension.”
Message: “Debug session was finished without being paused. It may be caused by path mappings misconfiguration or not synchronized local and remote projects. To figure out the problem check path mappings configuration for ‘localhost’ server at PHP|Servers or enable Break at first line in PHP scripts option (from Run menu)
The last time I updated Lando, toggling Xdebug via the browser extension no longer worked. Now I just toggle Xdebug by switching the “listen for debug connections” setting within PhpStorm.
Hi there,
Tried this but using remote_autostart (which was ideal for me in terms of speed) but xdebug never connects to phpstorm using port 9002. I’ve setup everything and added those lines into my php.ini. Any clues on where to look?
Xdebug log says this:
W: Creating socket for ‘172.19.0.1:9002’, poll success, but error: Operation now in progress (29).
E: Could not connect to client. 🙁
Thanks!
Hi Pedro, it sounds like Xdebug is listening to port 9002 but PhpStorm is not configured for that port. Try updating the debug port setting in PhpStorm, https://www.jetbrains.com/help/phpstorm/configuring-xdebug.html#integrationWithProduct. Let me know if that works for you.
Hi Tim,
Thanks for getting back.
I already have PHPStorm with the port 900. Even in the terminal it shows that that port is being used by PHPStorm.
The Funny thing is that phptorm registers whenever drush commands run.
Hey,
Quick update.
Got this working by setting remote_connect_back to so that xdebug uses the remote_host for the connection.
Throwing this here as it might help someone.
Thank you!
hello Pedro,
I’m experiencing the same problem,
Could you share your php.ini settings please?